In this installment of our IT Partners blog on ABAP and Quality, I will be inviting a good friend of mine Gennady Shlyapintokh to teach us about using the Memory Inspector to analyze the memory usage of an ABAP program. Typically, you use the Memory Inspector when you want to find out the following:
- How much memory does an ABAP application use? Is the usage higher than I expect it should be?
- Does an ABAP application have memory leaks? Does the memory consumption of the application increase over time? If so, where, in which objects?
Here is a brief intro to Gennady…..
 Years of IT Experience in the USA – 25. Consultant, Developer, Project Leader, President of the Consulting Company. Technologies Used: SAP, Java, Oracle, C, C++, and Visual Basic. Two Master’s Degrees: Oceanography from Russian State Hydrometeorological University, Saint Petersburg. Computer Science from Loyola University, Chicago, IL. USA Companies worked for: Baxter Healthcare, Cardinal Health, Sargent and Lundy, LLC, SAP America, Inc., GSHL Consulting, LLC. Hobbies: Learning, Traveling, Fishing, Boating, Riding Motorcycle, Camping, Hiking, Writing Silly Stories, Speaking Russian on weekends. Countries Lived: USSR, Belarus, Russia, Latvia, Italy, USA. Countries Visited: May be 70? You can reach me at [email protected]
Roll Area Too Small
Here is the problem: The SAP job abended with – Roll Area Too Small error. This is a sure sign of High Memory Usage! A usual step in resolving a job abend problem is to go to the ABAP dump analysis – Transaction ST22. In my case no ST22 entry is created.
Next, I will search on the internet (you can go to http://scn.sap.com/ but these days a regular Google search in most cases is sufficient) produced number of advices mostly checks the memory parameters:
ztta/roll_first
ztta/roll_area
rdisp/roll_SHM
rdisp/roll_MAXFS
em/initial_size_MB
ztta/roll_extension
abap/heap_area_dia
abap/heap_area_nondia
abap/heap_area_total
These parameters are available with the transaction RZ11 – Profile Parameter Maintenance. Also there are recommendations what values these parameters should have. Useful suggestions, no doubts but I have three problems with it:
- My client is a very large company with long established SAP systems that processes a huge number online and batch processes every second. Thousands of users logon every morning. Not likely that Basis will change SAP Profile Parameters for my job.
- This job successfully processed in test and QA systems with similar number of records to process – hundreds of millions.
- I do not have access in Production, QA, or Test systems to RZ transactions – so I can’t even check what parameters are to start conversation in the parameter direction.
As unpleasant is the fact that we developers not always can talk to Basis directly, and anytime we need and as painful could be all Authorization limitation – I have to do my best to resolve this problem with available to me tools. Only when I definitely run into wall with my tools – I will try to find other routes to resolution.
Well my most proven tools are not in any particular order
– Debugger
– People around me and in my wider network
Reasoning Toward Resolution.
I wrote the program that abended. Most likely problem is in the code. Several previous Production runs were successful. It could be combination – a code problem and the data.
I tried to repeat the Job run – the same result – Roll Area Too Small. This is a positive result – at least we have consistency.
Debugging during job run would be a great help but I cannot do it for two reasons:
- Job runs hours before abend – who can seat and wait hours before the next debugging step or processing in the debugger hundreds of millions of records.
- We are not encouraged to debug in Production.
The first obstacle is not as bad as it sounds – I’ve done complex debugging through huge volumes before – second problem is more of a challenge… I’m coming to a realization that I need to debug in the Development system with relatively small size of data and monitor the memory consumption in order to isolate roll area problem.
Program that is Abending to Roll Area to Small
Program name is generic and made-up, but the SAP tables are real….
This program – The Invoice Flow Analysis reads Goods Receipts (GR) in the tables MKPF and MSEG with some date offset back in time. These tables have hundreds of millions of records and are processed with a Cursor technique. For all selected GRs corresponding Purchase orders are found and the Invoices (IR) that came into system are matched against back dated GRs. If GR is left without invoice for a specified period of time the letter is generated and is send to the vendor – Please send us an Invoice – we do not need your money and wanted to pay you.
The letters are created in PDF format and saved to the database as an XSTRING data type.
After some time we check again and if the Invoice still did not come the program will issue a second letter – saved to the database.
I think it is enough for the program description and I’ll move to my Debugger.
Problem Resolution
With a New Debugger SAP provided a tool – Memory Analysis. This tool is available via the “New Tool” button ![]() while in the Debugger. When you click on this ICON you will see the screen below… Please note i have highlighted the Memory Analysis tool.
while in the Debugger. When you click on this ICON you will see the screen below… Please note i have highlighted the Memory Analysis tool.
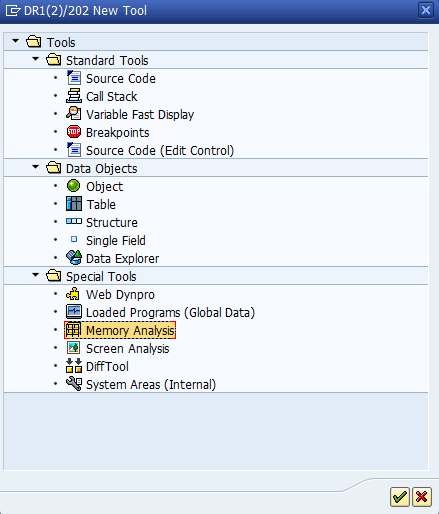
When this tool is turned on I was able to monitor Allocated and Used Memory at each step going through the code.
Note: The Internal Session is the Roll Area.
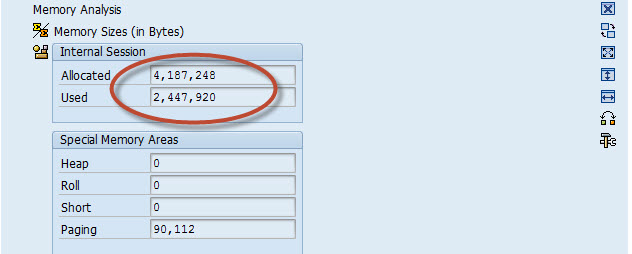
I was not interested in the absolute numbers just trying to establish a pattern of changes.
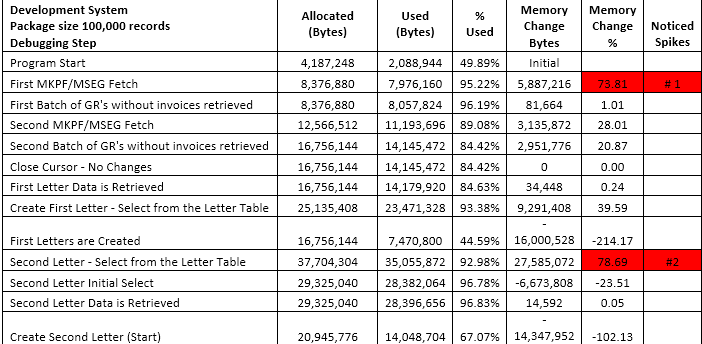
I noticed two obvious spikes:
- The Initial for the select from MKPF/MSEG. Here I have some leverage with the Cursor Package size. I tried different Package sizes – yes, there is some difference in memory consumption which is obvious – the smaller number of records we need to keep in the internal table the less memory is needed. However my job abended when I decreased package size significantly anyway. I can control the package size via program variant.
- The second spike is when the Program selects from the Letter table for the Second letter. By this time the first letters are created, PDF is saved and committed. We select all open First letters and check if time has passed for the Second letter to be issued.
The code where the memory spike occurred looked like this:
Select all the records that are already in the Letter Table.
SELECT
             lifnr
             ebelp
             ebeln
             mblnr
             mjahr
             zeile
             first_letter_dt
             second_letter_dt
             status
             letter_1                        "This is a PDF of the letter
 FROM
             z_letter_table
 INTO CORRESPONDING FIELDS OF TABLE
             li_letter_table
 WHERE
             status = first_leeter_open.
The Light went on:
While selection not just a letter meta data for the processing purposes I was selecting an actual PDF – which is quite big. With every production run more data is accumulated in the data base and the allocated memory is exhausted sooner.
I really do not need to select letter_1. The reason is that I was using the MODIFY statement – easier to code:
I change some fields, create PDF for the second letter and issue call:
MODIFY z_letter_table FROM wa_letter_table.
By selecting the first letter I do not need to update the specific fields in the Update call.
At the expense of the Memory consumption. And the Job abend. Not good.
I changed my select statement to…
SELECT
             lifnr
             ebelp
             ebeln
             mblnr
             mjahr
             zeile
             first_letter_dt
             second_letter_dt
             status
 FROM
             z_letter_table
 INTO CORRESPONDING FIELDS OF TABLE
             li_letter_table
 WHERE
             status = first_leeter_open.
Changed the DB update call to…
UPDATE z_letter_table
 SET
             Status             = wa_letter_table-status
             second_letter_dt   = wa_letter_table-second_letter_dt
             letter_2           = wa_letter_table-letter_2
 WHERE
             Lifnr              = wa_letter_table-lifnr  AND
             Ebeln              = wa_letter_table-ebeln  AND
             Ebelp              = wa_letter_table-ebelp  AND
             Mblnr              = wa_letter_table-mblnr  AND
             Mjahr              = wa_letter_table-mjahr  AND
             Zeile              = wa_letter_table-zeile.
Then I checked the memory consumption – Second spike was gone. Moved code up in the System Landscape. Stress test was passed.
Will see what happens with the next Production Run…..

You can investigate the use of the MEMORY INSPECTOR tool both as a stand-alone SAP Transaction or for use in the Debugger by clicking on the highlighted text.